Explaining the Risk Breakdown Structure Template
A Risk Breakdown Structure Template was developed to help project managers better navigate and overcome the challenges of risk management. All projects come with their fair share of risks and issues. Keeping track, monitoring, mitigating and resolving these ongoing risks is a critical part of ensuring project success. But constantly keeping an eye on the myriad of risks involved in large and complex portfolios is no easy task. That is why tools like the Risk Breakdown Structure template are essential.
Let’s dive deeper into Risk Breakdown Structure and look at the benefits it brings organisations and how you can start tapping into this valuable project management resource today.
What is a Risk Breakdown Structure Template?
Risk breakdown structure (RBS) is a project management tool that organizes potential risk sources into a hierarchical framework. RBS typically organizes risks in terms of a risk scoring system that helps identify high-level risks and enables teams to prioritise the most urgent risks to be addressed. It gives project managers greater clarity and visibility over both planned and unforeseen risks that may have a detrimental impact on project success.
A risk breakdown structure template is one of four other breakdown structure tools that enable project managers to better manage their projects. Some other breakdown tools you may tap into include:
- Work breakdown structure: A framework that divides projects into smaller workable chunks.
- Resource breakdown structure: A framework that helps teams divide resources, such as people, equipment and materials, across different projects within the organisation.
- Organization breakdown structure: A framework that outlines the organisation’s structure and clarifies the relationships between different positions.
Benefits of a Risk Breakdown Structure Template
Here are some of the key benefits of using a risk breakdown structure template:
- Provides complete visibility over project risks: Sometimes it can be hard to truly visualise the scale and severity of risks if they are not properly listed out, analysed and evaluated. A Risk Breakdown Structure Template encourages teams to take time to consider different planned and unplanned risks and then chart out how they may impact the success of the project.
- Enables effective risk prioritisation and management: When you can see a problem, you are able to solve them more effectively. The RBS allows teams to properly prepare themselves by identifying and prioritising risks and building the proper risk management strategies to mitigate their impact.
- Allows for easy risk monitoring and reporting: A risk breakdown structure makes your ongoing monitoring and reporting activities much easier as you can easily upgrade or downgrade risk levels as the project progress. When paired with powerful project management software, you can take this to the next level with intuitive RAID logs, risk breakdown structure templates, and a real-time dashboard that ensures your teams are always on top of project risks at all times.
- Pinpoints recurring risk themes: Sometimes the most pressing problems and risks can be those that hide right under our noses. RBS helps clearly identify and define risks that in turn enables teams to spot potential areas where risks are recurring and allow them to build proper strategies to mitigate or resolve these risks.
- Defines overall project risk exposure: One of the contributing factors to project failure is failing to understand the full scale of the risks involved with it. RBS helps teams get an early outlook of the project’s overall risk exposure to justify whether the project is worth starting in the first place.
How to Create a Risk Breakdown Structure in Six Easy Steps
While there are no definite rules on how you should use a risk breakdown structure. Here are six general steps that feature in a risk breakdown structure template.
Step One: Identify risk sources
Identifying the different risks is the first step to properly evaluating and mitigating them. This requires project teams and managers to deep dive into both planned and unplanned risks by asking certain questions such as:
- What areas of the project are vulnerable or vague?
- What risks have occurred in previous projects that could also occur here?
Some ways you can identify project risks is through brainstorming sessions, workshops, root-cause analysis, review of project documents, and SWOT analysis. A particularly handy tool during this process is to create a risk log or register that clearly lists, documents and defines risks. It also clearly outlines the different stakeholders and the risk management measures adopted for each risk.
Step Two: Categorising risks
A risk breakdown structure template will not only break down risks by ‘level’, but also further define risks by their category. Four common risk categories include:
- External risks: risks that are outside the direct control of the team or organisation.
- Internal risks: risks that are within the control of teams or the organisation.
- Technical risks: risks that arise due to the ambiguities from technical requirements, scope or obsolete technology.
- Project management risks: risks that can impact the everyday monitoring and managing of project activities.
However, you should not feel limited by these categories. Depending on your project needs you may need to create additional categories that are relevant to your project and risks.
Step Three: Analysing risk levels
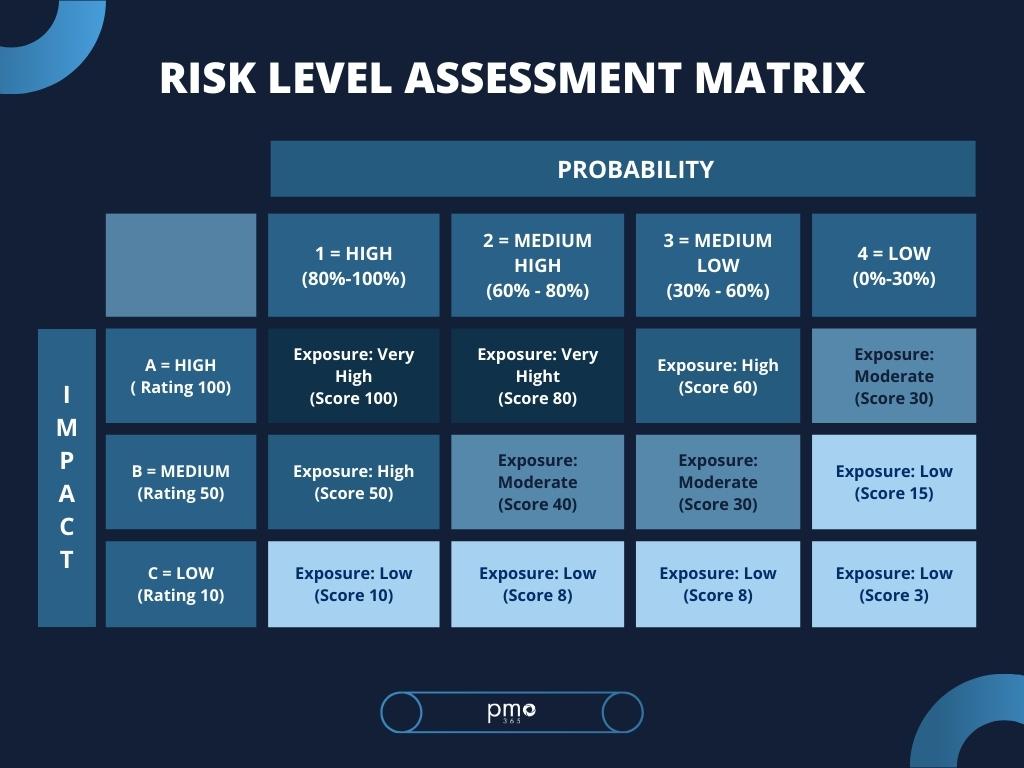
The Project Management Institute recommends using two base factors to analyse risk levels.
i) measuring the probability of the risk occurring:
Probability of risk occurring:
- High probability (80% ≤ x ≤ 100%)
- Medium-high probability (60% ≤ x
- Medium-low probability (30% ≤ x
- Low probability (0%
and
ii) evaluating the level of impact it has on overall project success.
Level of risk impact:
- High: catastrophic (rating A – 100)
- Medium: critical (rating B – 50)
- Low: marginal (rating C – 10)
Each risk is then evaluated and given a score rating by multiplying the risk of impact rating with the probability of the risk. This has been simplified in the matrix below:
Step Four: Reporting and monitoring risks
Consistently reporting and monitoring risk is a key function of project management. Communicating risk assessment outcomes to critical stakeholders is important for managing expectations, providing a deeper understanding of current project risks, and helping them make more informed decisions.
It is important to note that risks reports are not the same as the project risk register, and should only contain the most relevant or significant risks for key stakeholders. Also, risk reporting is a task that should be done periodically and consistently.
Step Five: Conducting post-project reviews and comparisons
Risk management best practice is to conduct a post-project review of overall risk identification, analysis and mitigation activities. One of the key benefits of an RBS is that it provides clear documentation of risk management activities and escalation throughout the entire project process. This can be done by conducting post-project review sessions on workshops through which teams can gather and discuss their performance.
Additionally, teams can also pull from other projects to compare their RBS frameworks and risk management practices to further optimise their activities for the next round.
Step Six: Document lessons learned
Do not let any valuable experience and knowledge go to waste! Make sure to spend time properly documenting the lessons learned from your risk management and RBS related activities to help build a repository of data and knowledge that can help make your next risk breakdown structure more accurate and effective.
Start building your Risk Breakdown Structure today!
We don’t just want to talk about all the benefits of a risk breakdown structure. We want to help you tap into its benefits right now! That is why we have made a risk breakdown structure template just for you that you can customise and edit as you see fit. If you still want to learn more about risk management and risk management tools, make sure to check out our amazing blog that dives deeper into risk management strategies, best practices and tips!